Advanced Data Visualization
Spring 2024 - Dartmouth College
During my enrollment in Advanced Data Visualization, I significantly enhanced my capacity to convey complex social science research findings through advanced graphical representations, specially tailored for web and publication platforms. Through a series of immersive projects, I delved deep into the intricacies of JavaScript, HTML widgets, and dashboards, mastering the creation of dynamic and interactive visual narratives suitable for dissemination on social media and the web.
This hands-on experience not only sharpened my technical skills but also provided invaluable insights into the art of storytelling through data visualization. By leveraging R programming and harnessing tools like ggplot2, I adeptly transformed raw research data into compelling web-based visualizations, each meticulously designed to effectively communicate patterns and insights gleaned from real-world research.
Furthermore, by building upon the foundational principles learned in previous coursework, such as QSS 17, I developed a nuanced understanding of good visualization practices and color theory. This enabled me to craft visuals that not only captivate audiences but also convey information persuasively and without bias.
By the culmination of the course, I emerged with a refined skill set and a robust portfolio of interactive and animated web-based visualizations, each showcasing my ability to distill complex data into engaging and informative narratives fit for a variety of publication mediums.
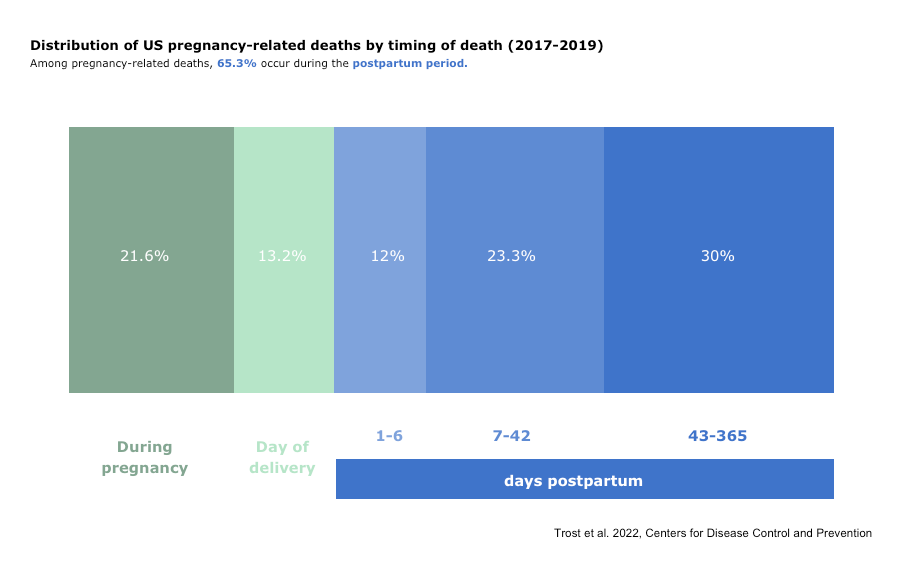
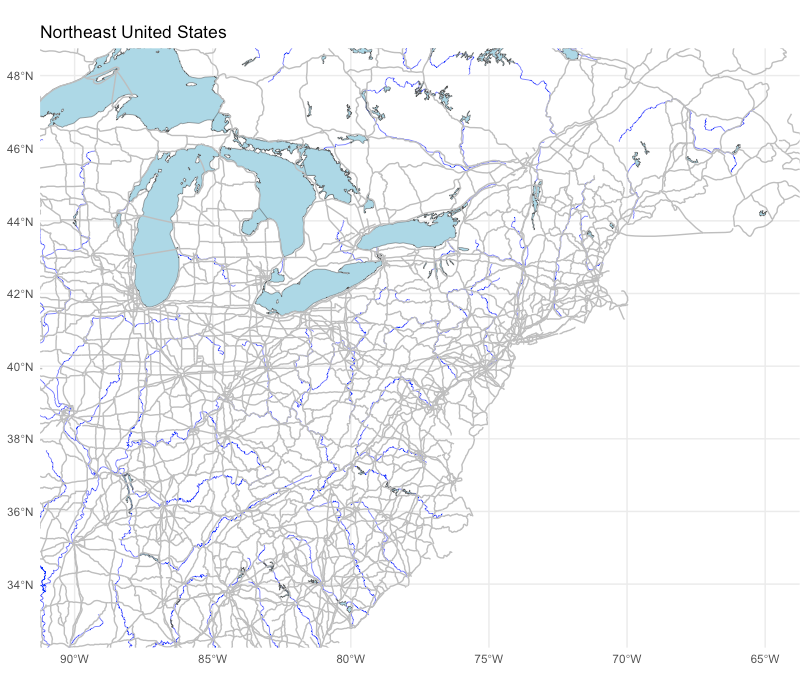
Timeline plot
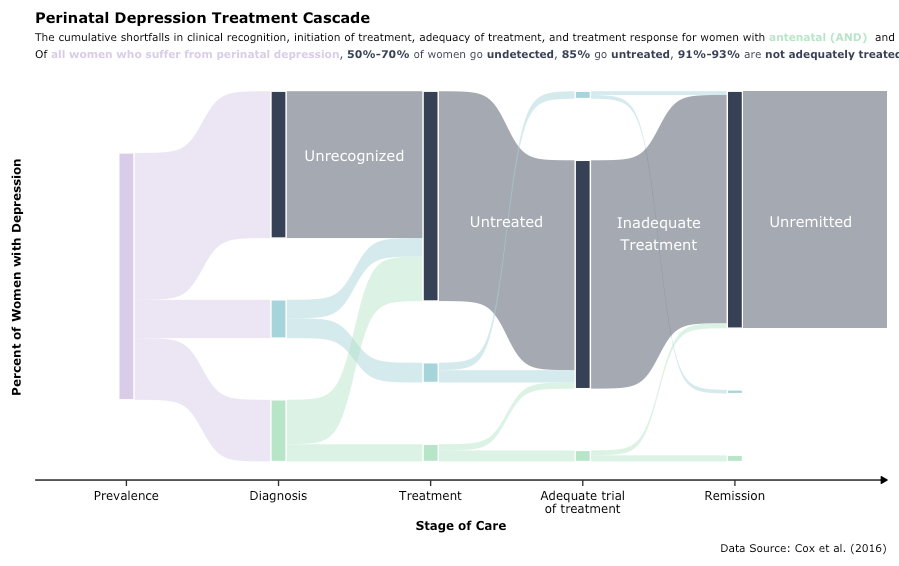
Sankey plot
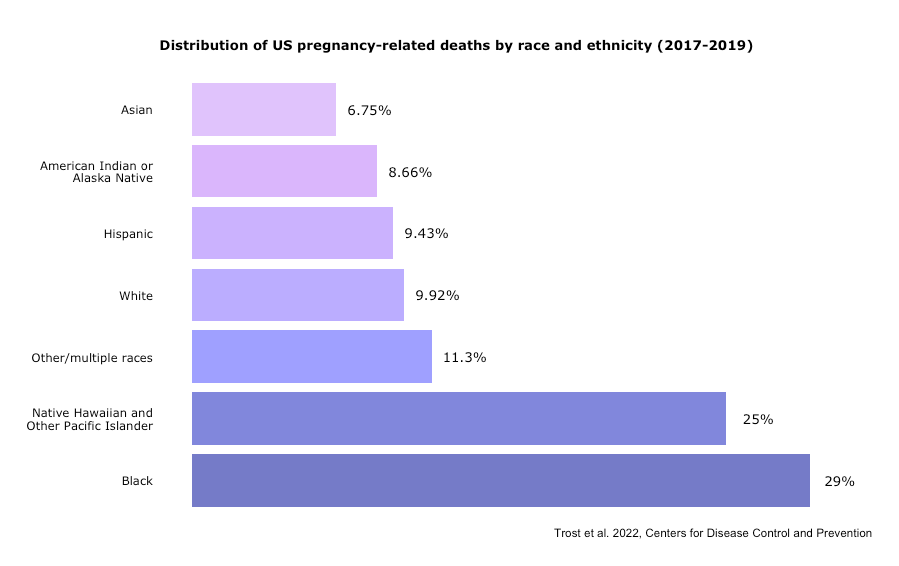
Bar chart
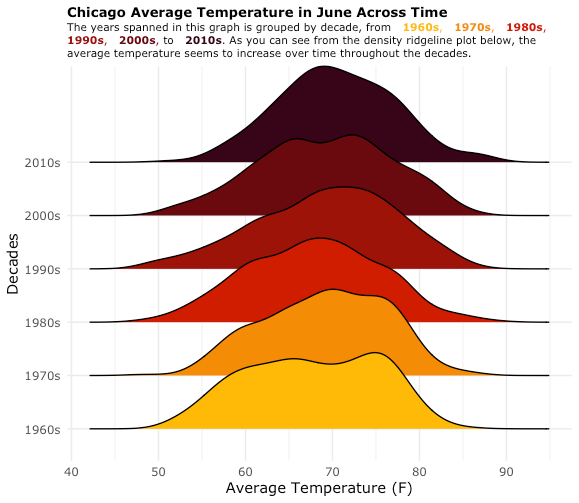
Density plot
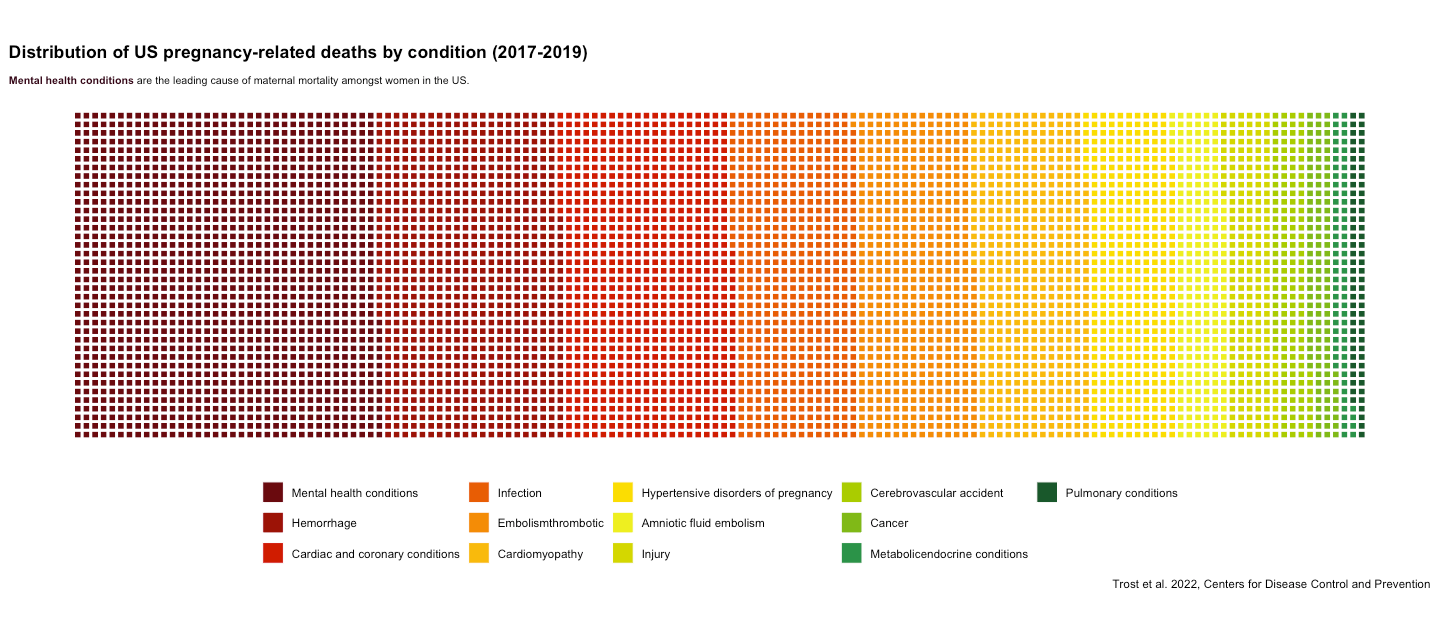
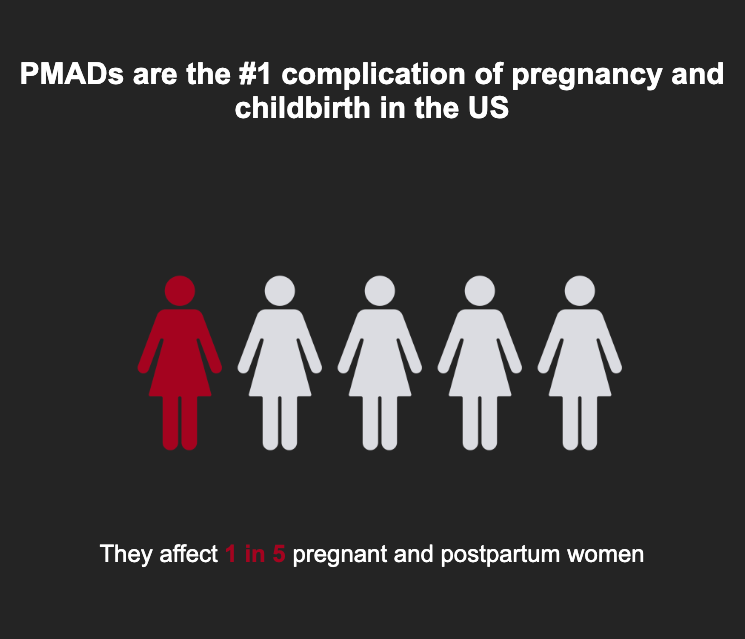
Waffle plot
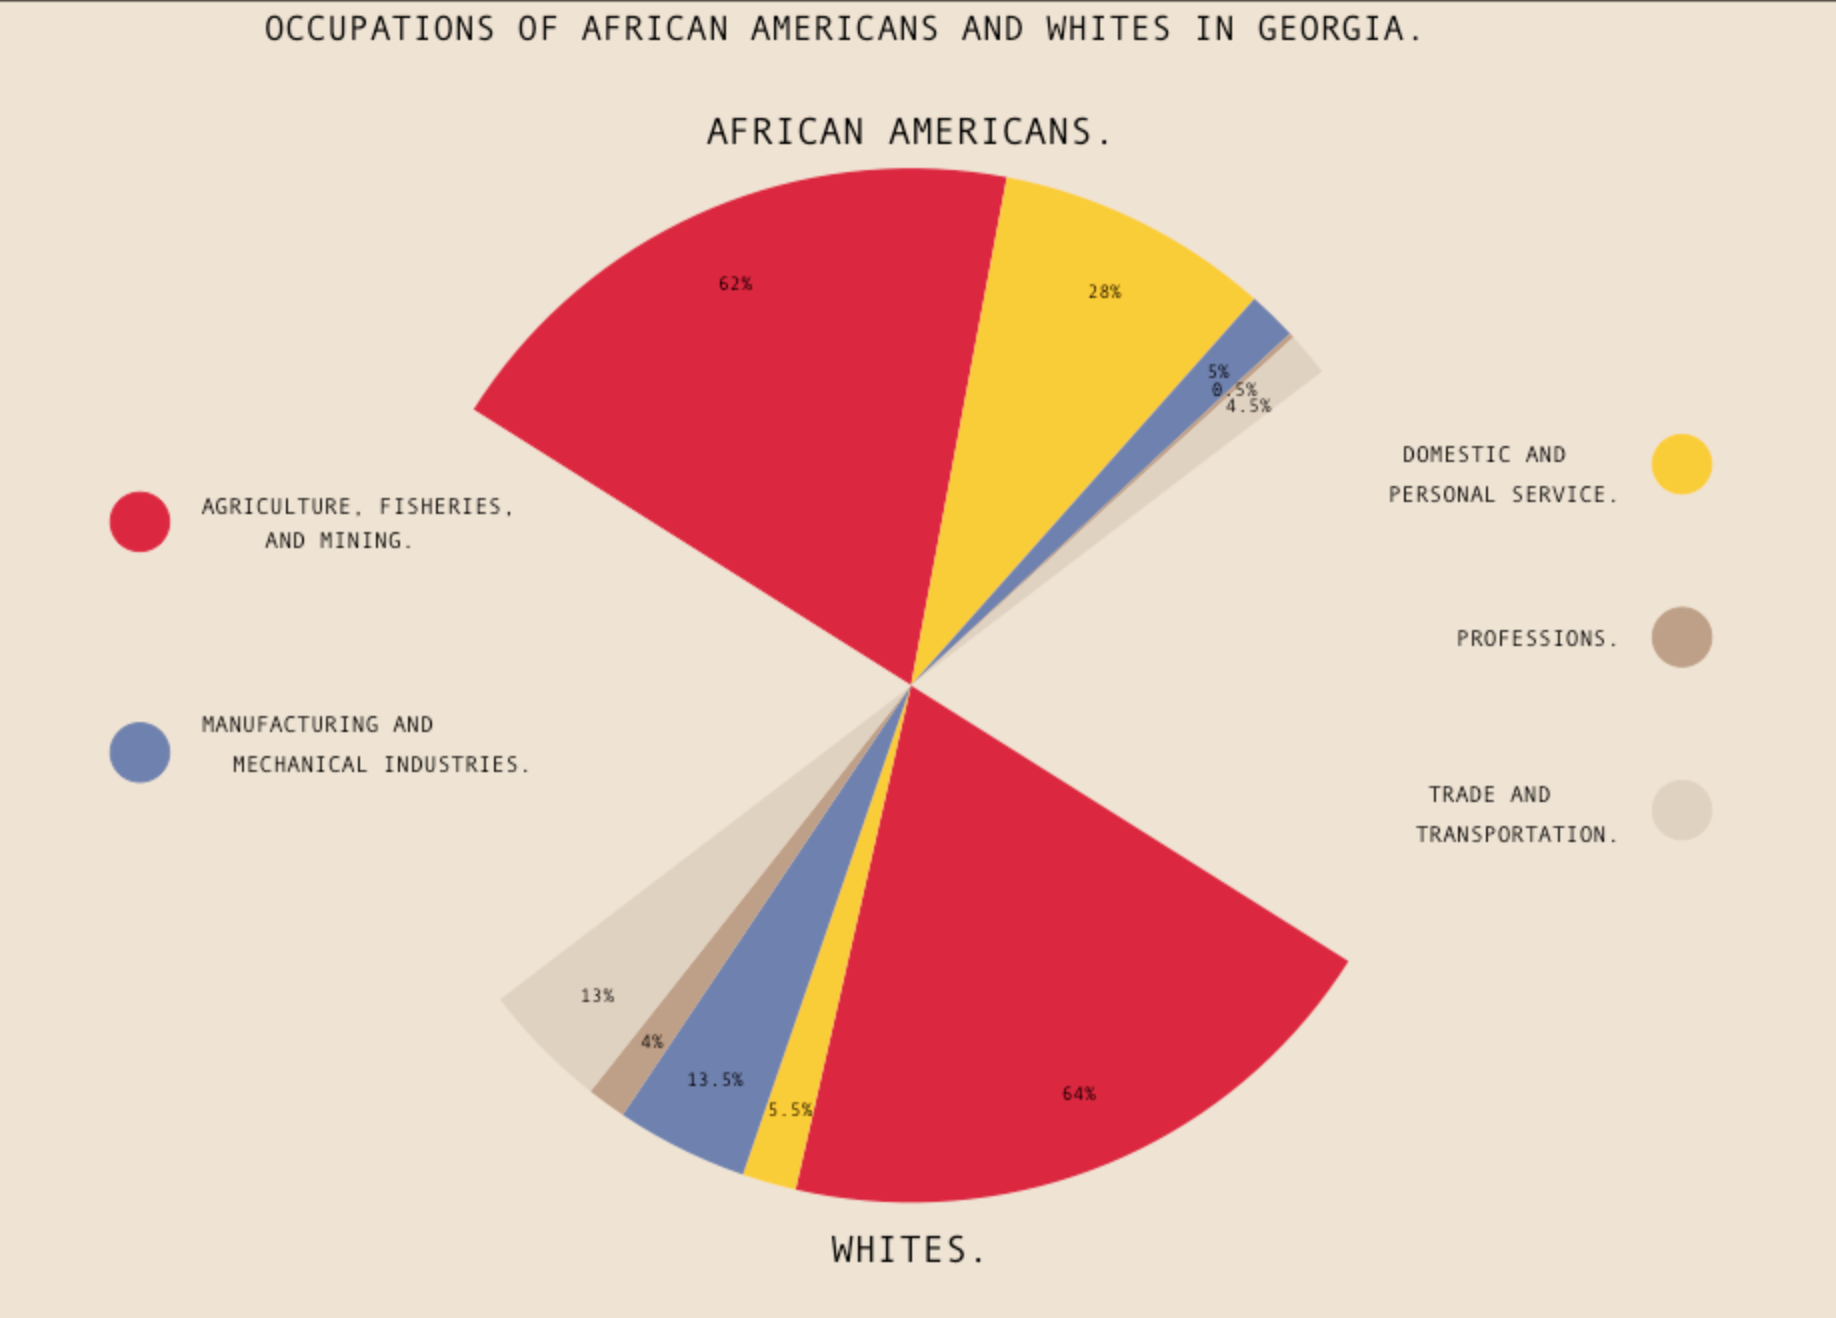
WEB Dubois Recreation Plot
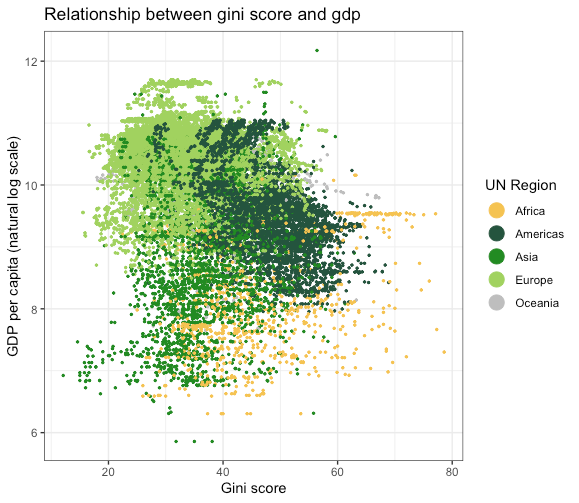
Scatter plot and custom color palette
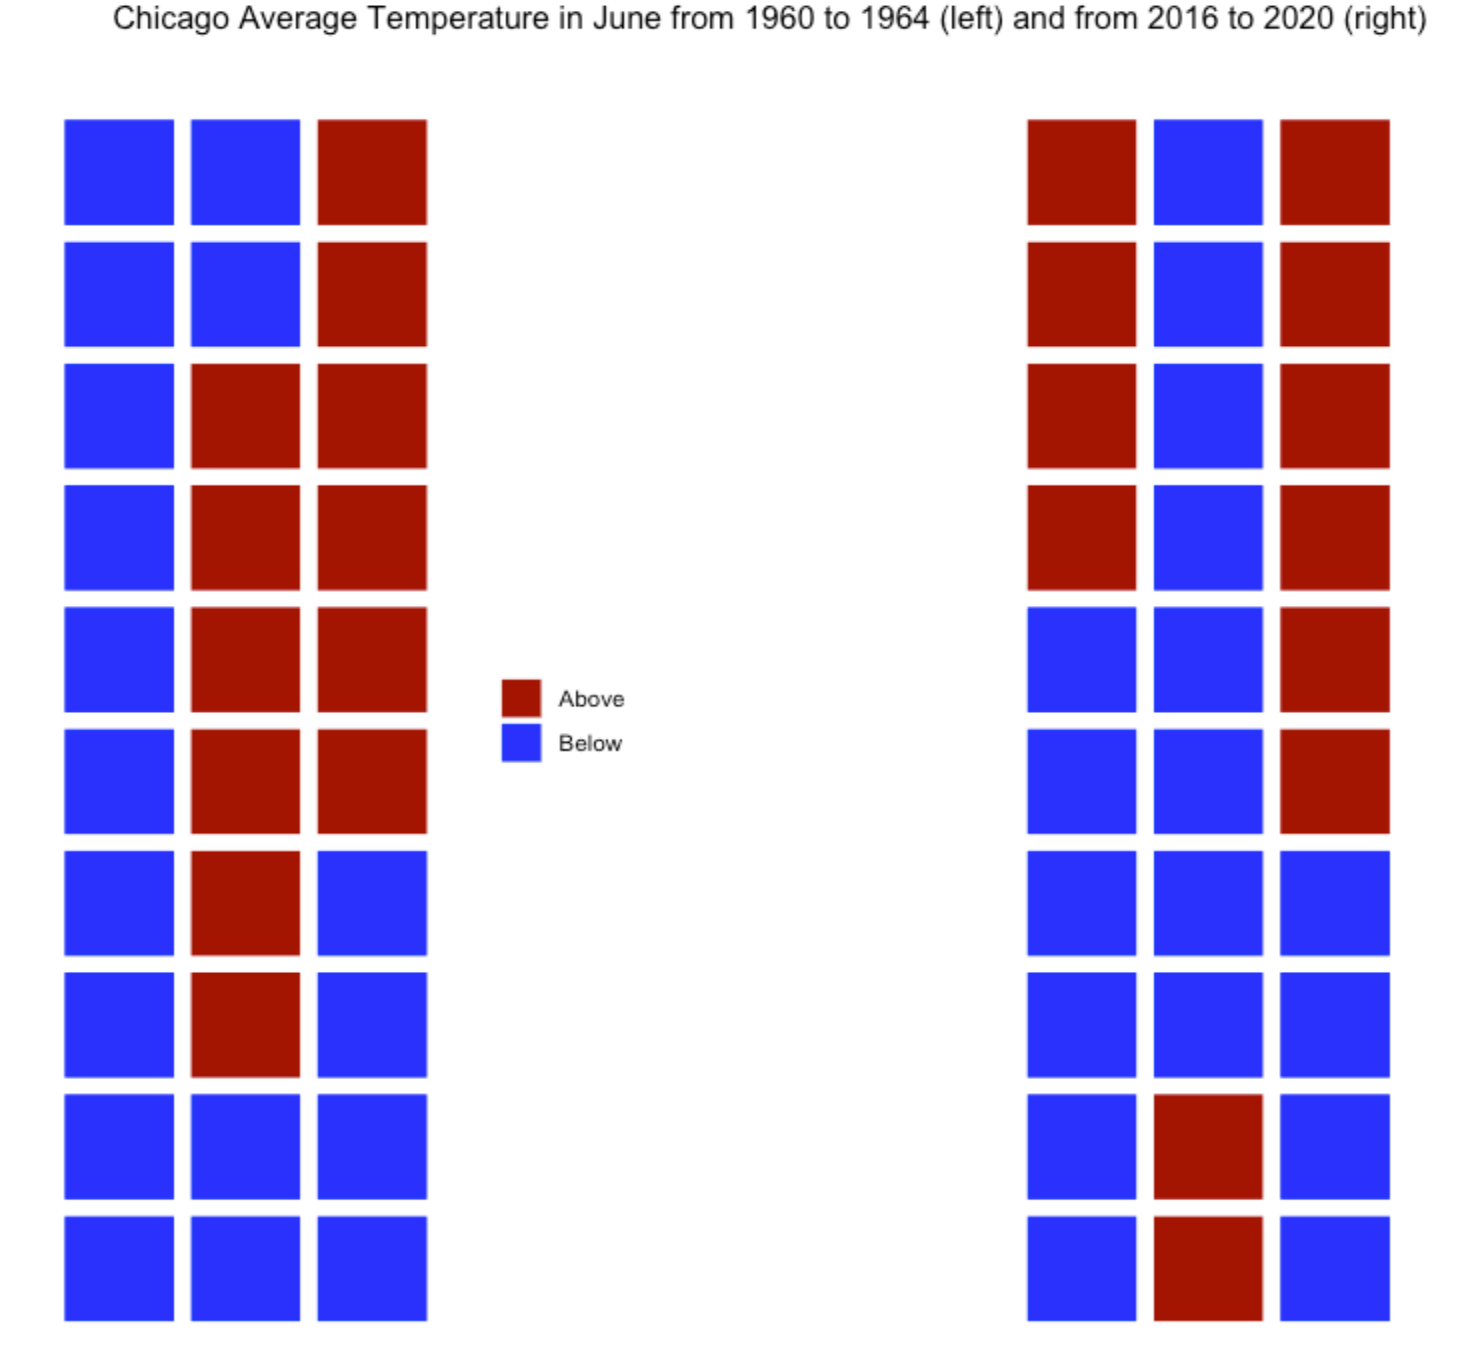
Waffle plot
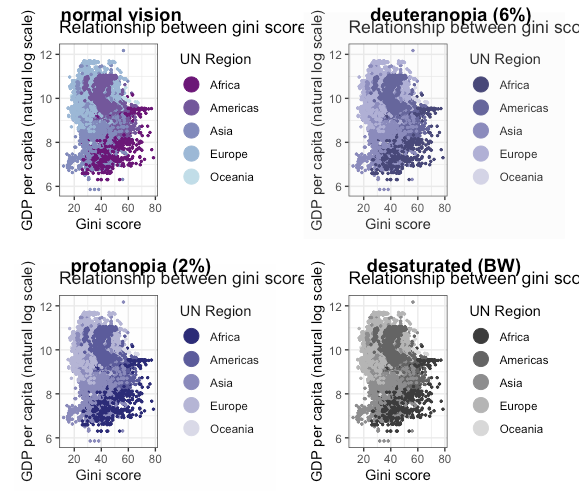
Color blind test
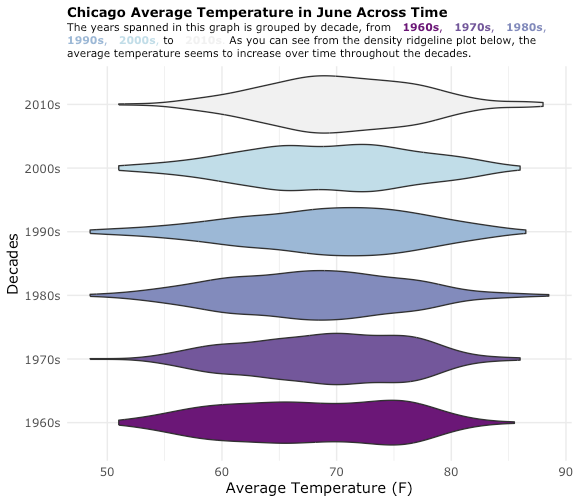
Raincloud plot
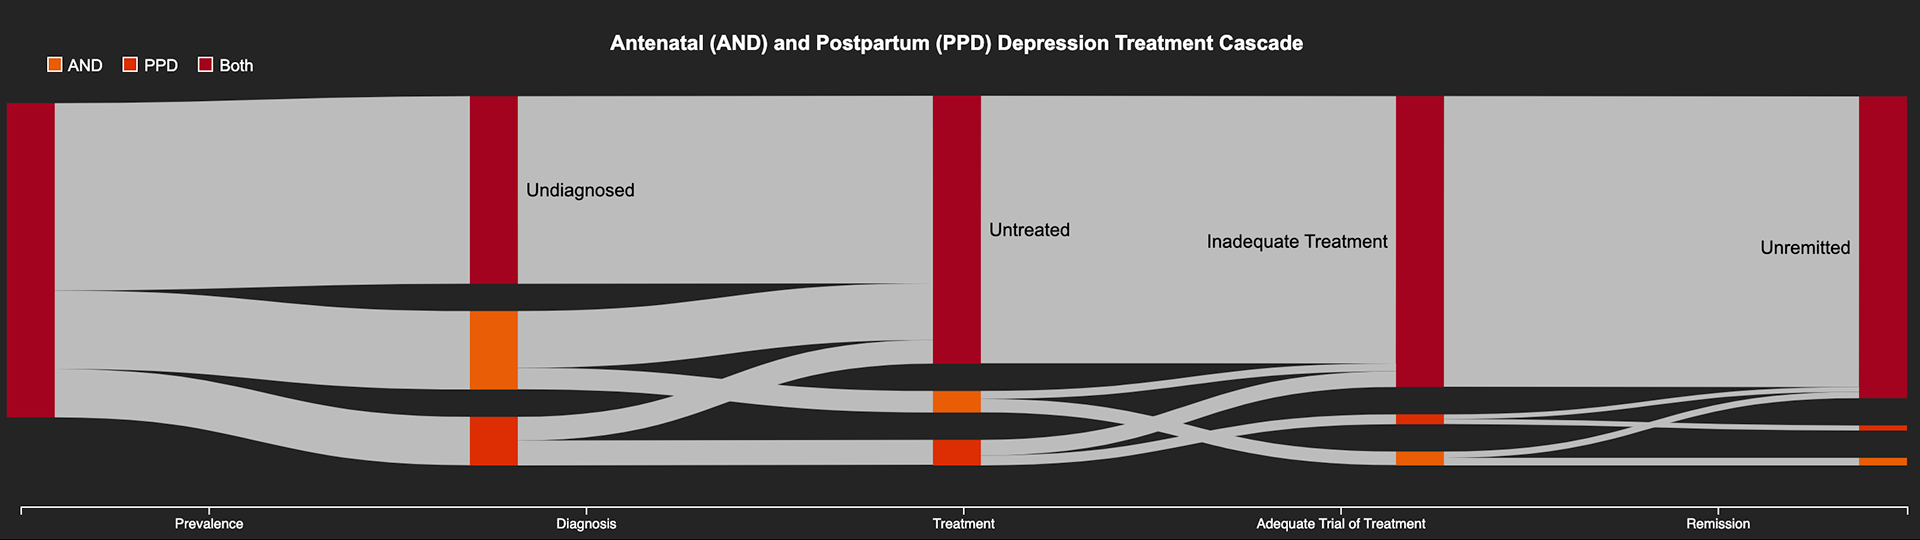
Sankey in D3 JS
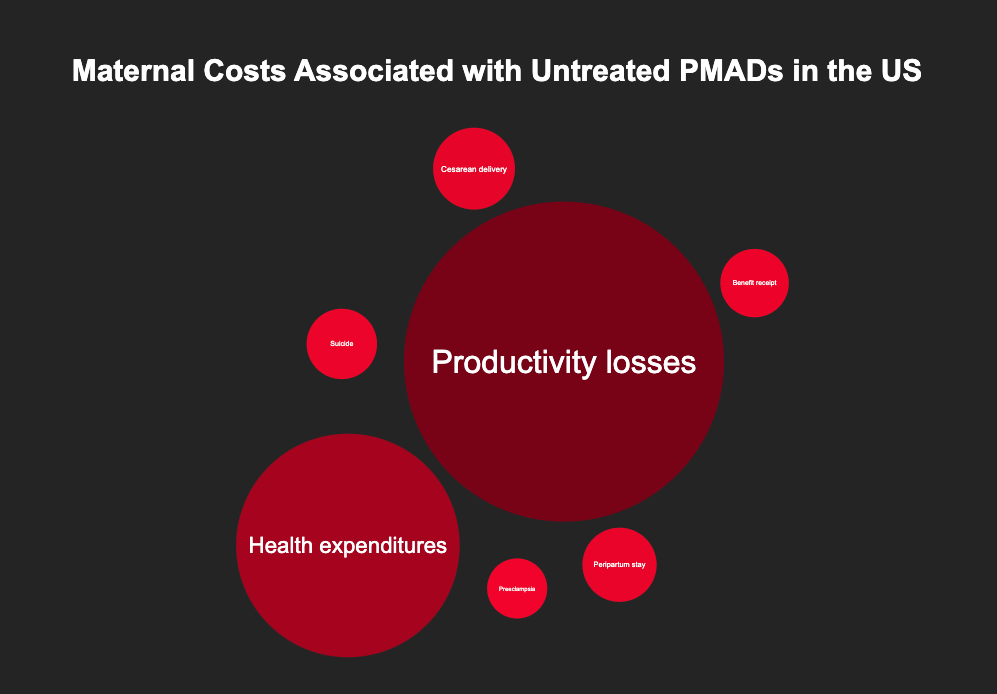
Bubble Cluster Plot in D3 JS
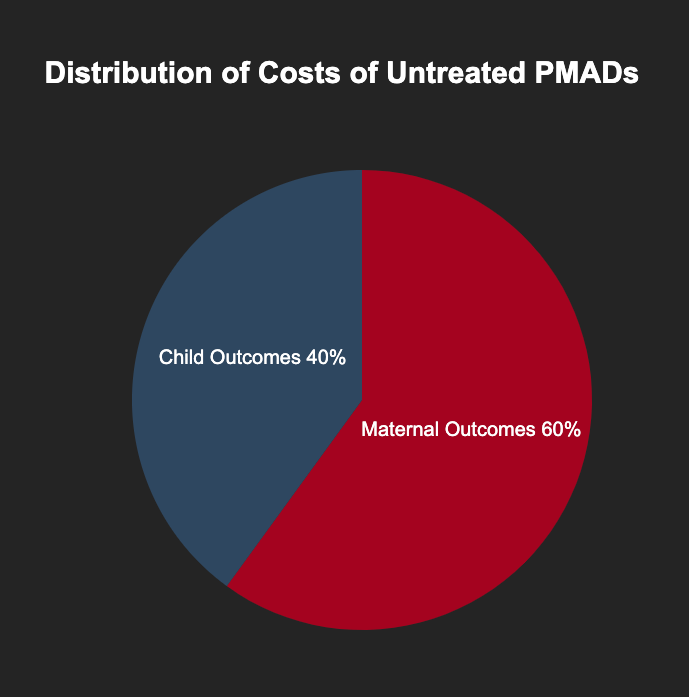
Pie Plot in D3 JS
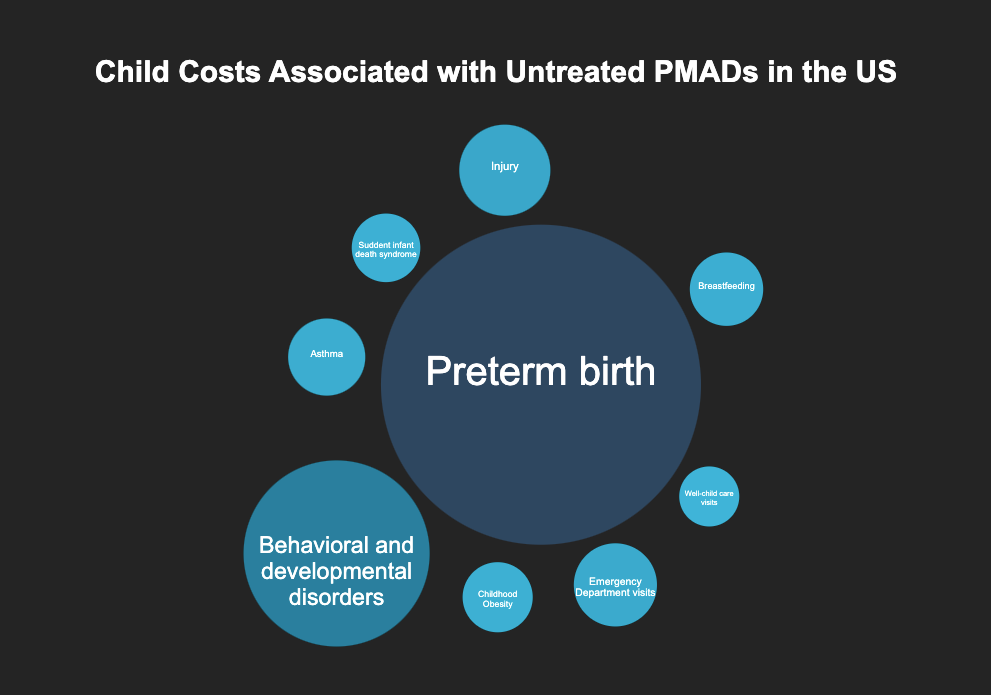
Bubble Cluster Plot in D3 JS
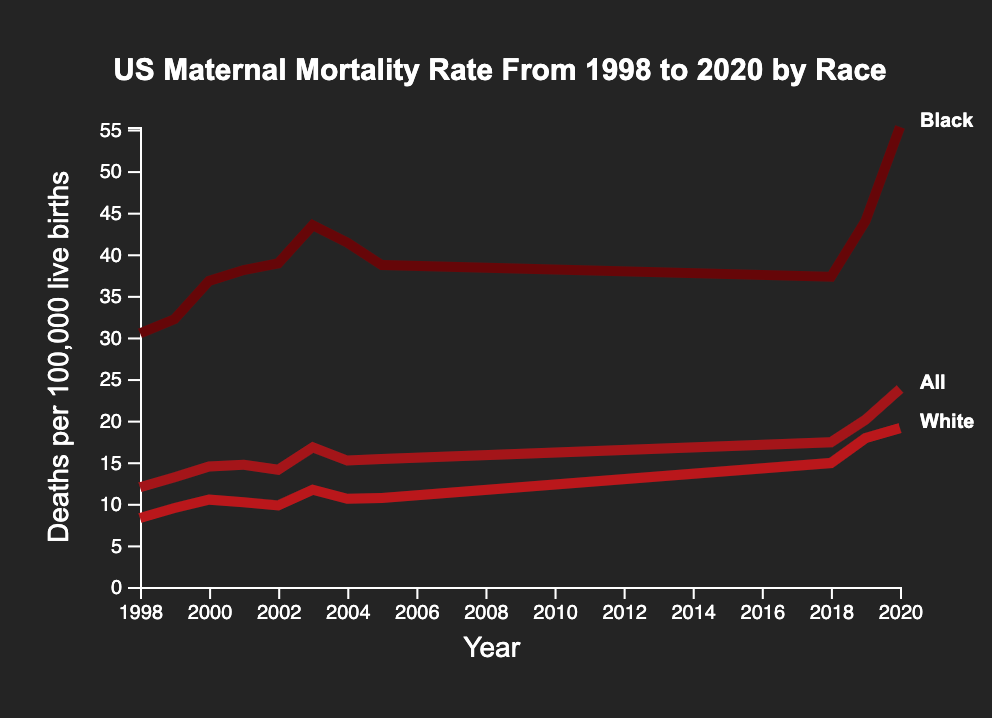
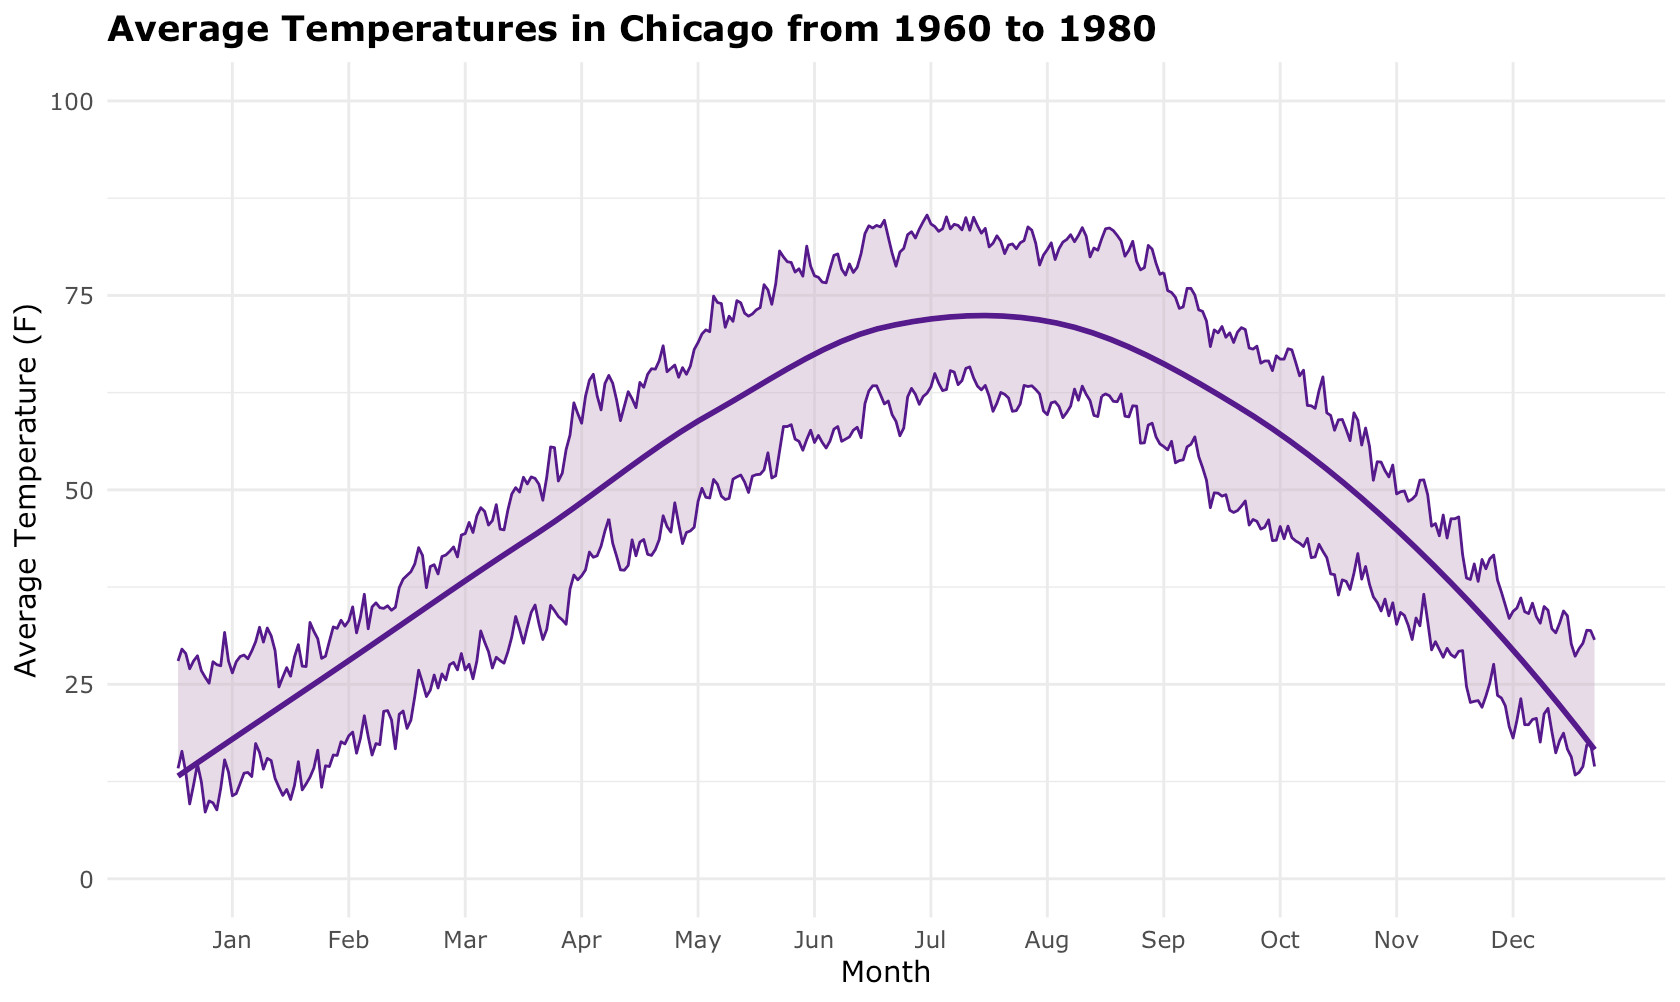
Line Graph in in D3 JS
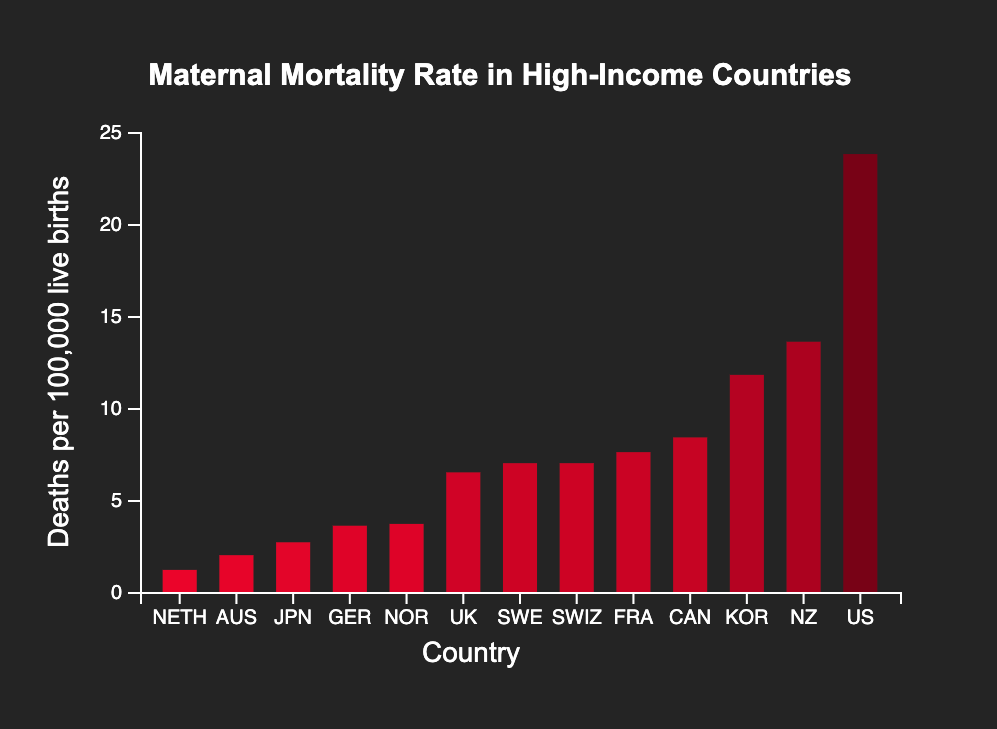
Bar Chart in D3 JS